Local
Who Pays for the Sand? Twenty Years of Indian River County Beach Spending Top $102 Million
County records reveal $102 million in Beach Restoration Fund expenditures through September 2024, raising questions about financing, erosion and public versus private benefits.
Staff Writer
2 de nov. de 2026
When the next storm strips sand from Indian River County's coastline, the damage can be visible overnight. Replacing that sand, however, can take years of planning and millions of dollars. A review of county budget books and financial reports identifies $102,010,035 in actual expenditures from the county's Beach Restoration Fund over 20 fiscal years, from October 2004 through September 2024.
The figure raises questions that are increasingly relevant to residents who pay taxes, use public beaches and watch repeated restoration work along the barrier island: What exactly was purchased? How much of the shoreline is being protected for public use? And when public money restores dunes beside private oceanfront homes, who receives the benefit?
It is important to be precise about what the $102 million represents. It is total spending recorded in the county's Beach Restoration Fund, not a bill for sand alone, and not a tally of what Indian River County homeowners personally paid. The fund also supports coastal management, project design, monitoring, biological protection and related activities. It receives revenue from multiple sources. Separately managed Sebastian Inlet District expenditures are not included in this county-fund total.
Twenty years of spending, one year at a time
The following numbers are actual expenditures for Indian River County's Beach Restoration Fund as reported in archived county budget comparisons and financial reports. The figures reflect the government's fiscal year, which begins October 1 and ends September 30. They are not proposed project prices or future budget appropriations.
The chart below shows annual expenditures across all 20 fiscal years.
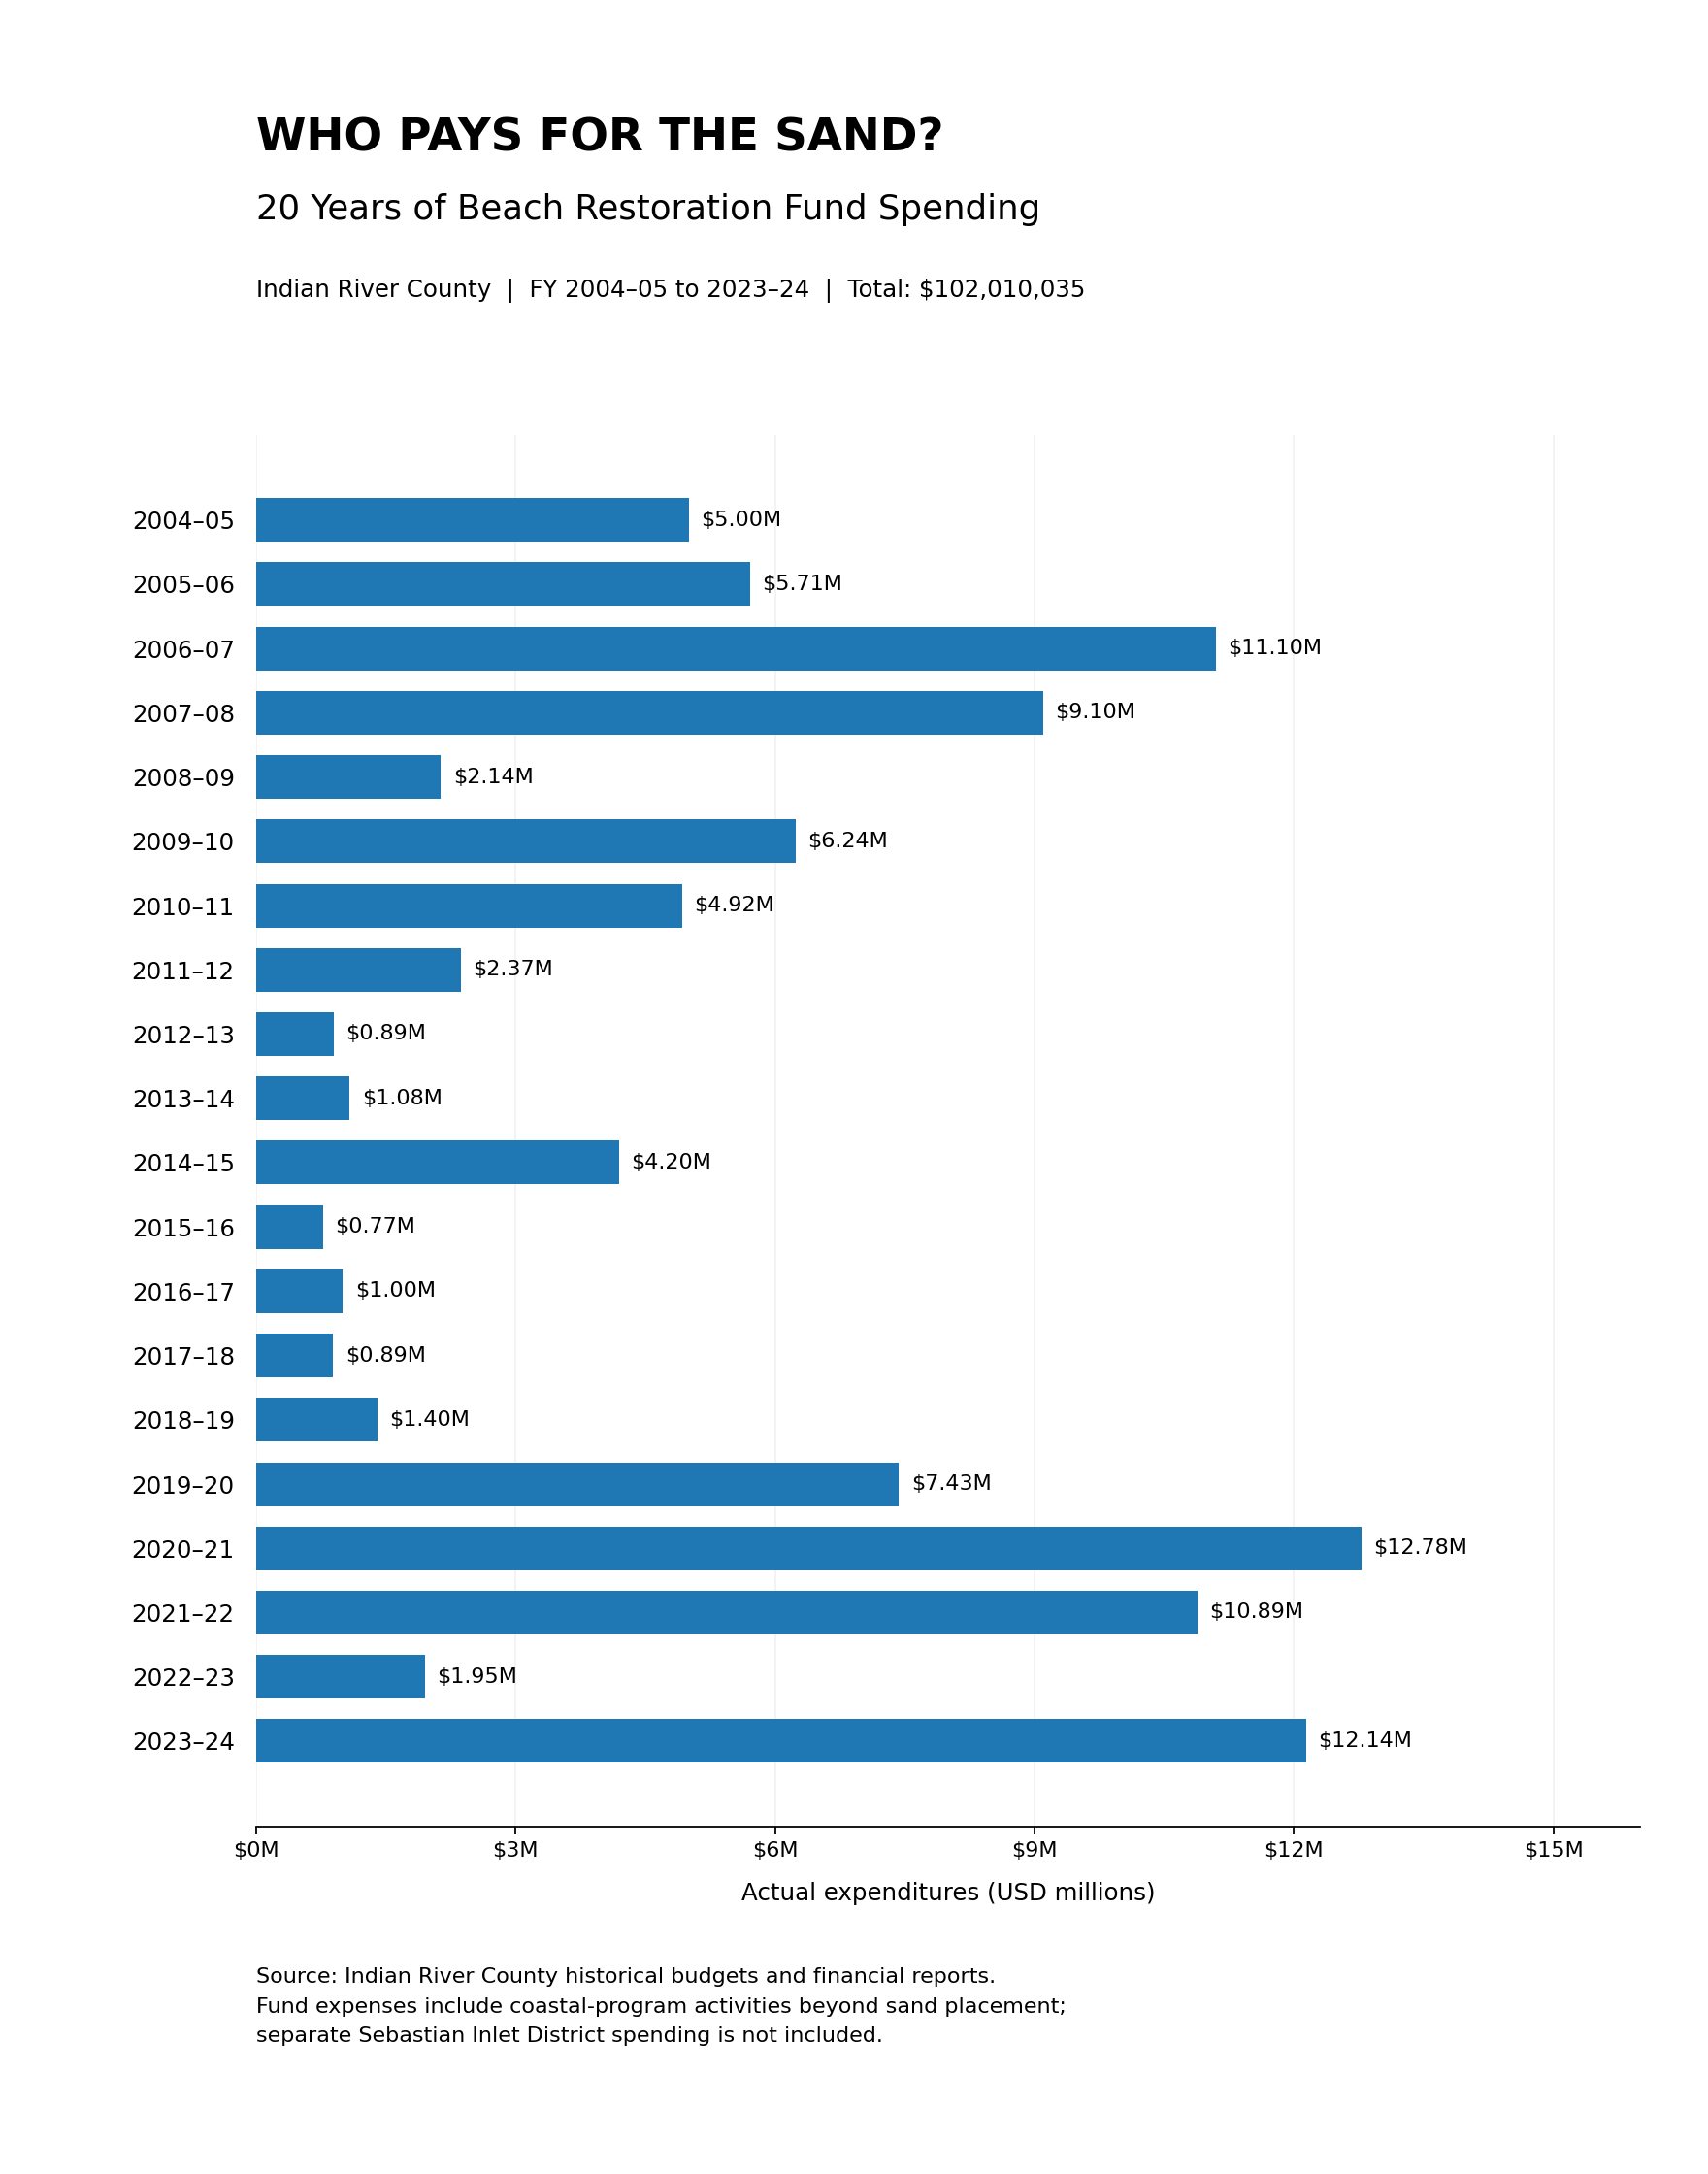
Indian River County Beach Restoration Fund expenditures by fiscal year, 2004–05 through 2023–24. Total reported spending in the 20-year series: $102,010,035.
Source: Indian River County historical budgets and financial reports compiled by IRC Media.
What the peaks mean—and what they do not
Spending has not followed a flat annual schedule. The fund recorded approximately $11.1 million in 2006–07, $12.78 million in 2020–21, $10.89 million in 2021–22 and $12.14 million in 2023–24. In other years, the fund spent less than $1 million. Over the 20-year period examined, the average was approximately $5.1 million per fiscal year, but that average conceals the wide variation in project activity.
Large expenses can coincide with construction, storm recovery, beach surveys, engineering and other coastal work. A high-spending year does not by itself establish waste, just as a low-spending year does not prove the shoreline was stable. To determine whether a particular project produced value, the public needs its contract amount, final payments, quantity of sand placed, share reimbursed by other governments and results of subsequent monitoring.
This investigation does not calculate an inflation-adjusted total, nor does it isolate all payments for sand from monitoring and other expenses. Those would require a consistent transaction-level ledger across the two decades. Without it, the figures should not be described as $102 million spent simply dumping sand into the ocean.
A newer year still needs to be reconciled
The last year in this complete historical series is fiscal 2023–24. The county's 2025–26 budget book lists $10,592,254 as the budget for the prior 2024–25 fiscal year and $10,400,329 as the 2025–26 budget. Those figures are appropriations, not verified actual expenditures, and have not been added to the $102 million historical total.
The clerk lists more recent annual financial reports, including the report for the year ended September 30, 2025. The precise 2024–25 actual Beach Restoration Fund expenditure still needs to be matched to that audited report before a total through 2025 is published. Fiscal 2025–26 ended only on September 30, 2026, and is likewise not part of this historical calculation.
Who supplies the money?
Indian River County does not finance every beach project solely through ordinary residential property taxes. Its Beach Restoration Fund is supported in part by local tourist-development taxes, the levy paid on eligible short-term accommodations. The county also pursues state and federal cost-sharing and reimbursement programs, including disaster-related assistance, and uses transfers and other revenues in particular years. The proportions change by project and by fiscal year.
That distinction matters to taxpayers. A $10 million project may not impose a $10 million local funding burden if some expenses are reimbursed. At the same time, money from visitor taxes remains public money that could be used only for purposes permitted by law. And state or federal grants are not free resources; they represent public revenue from broader tax bases.
The Sebastian Inlet District is a separate taxing and operating entity with responsibilities that include navigation and sand bypassing. Its budget and property-tax revenues should be audited separately, rather than mixed into the county's Beach Restoration Fund figures or counted twice.
Public beach, private property: the central fairness question
Beach nourishment can serve several public purposes. Rebuilt beaches and dunes can absorb wave energy, help maintain recreational shorelines, support tourism and protect wildlife nesting habitat. Coastal protection can also limit damage to roads, public beach accesses and other infrastructure. These benefits cannot be dismissed simply because a nearby house is expensive.
But the distribution of benefits deserves examination. Some restoration work runs beside residential oceanfront parcels, where a stronger dune or wider beach can directly protect privately owned land and structures. The county's own beach-management information says it seeks easements from oceanfront property owners before placing publicly funded material on private property in a project area.
An easement permitting restoration work does not, by itself, answer whether the public acquires a new right to cross private property to reach the beach. Those rights depend on the exact easement and applicable law. The county should be able to explain which sections provide public access, where access is limited and how that distinction affects project selection and financing.
A further question is whether direct beneficiaries contribute through special assessments or other mechanisms, and whether the county has analyzed their feasibility. Identifying that question does not establish that residents who live on the barrier island have received an improper subsidy; it identifies a cost-allocation decision that taxpayers can reasonably expect officials to document.
Did jetties and dredging make the erosion worse?
The suggestion that Sebastian Inlet affects the movement of sand is grounded in coastal engineering, not just online speculation. Florida's Department of Environmental Protection states that inlets can interrupt or alter the natural transport of sand along a coast. Its November 2023 Sebastian Inlet Management Plan is intended to compensate for those changes through sand bypassing to eroding beaches.
The plan sets an average target of 75,000 cubic yards of bypassed sand per year. That is not evidence that every eroded beach elsewhere in the county is the inlet's fault. Storm waves, changes in sea level, coastal development, seawalls and other processes can also influence the position and condition of the shoreline.
A separate Sebastian Inlet District project, reported completed in May 2026, placed more than 271,000 cubic yards on beaches south of the inlet and cost approximately $8.5 million. The district said the work qualified for at least a 50 percent state cost share. That is a distinct project managed by a distinct public body, not an additional line in the county's 20-year Beach Restoration Fund total.
For an accurate cause-and-effect analysis, the county and district should explain which beaches are classified as affected by the inlet, the amount of sand naturally moving along those beaches, the volume bypassed historically and how that compares with measured erosion farther south.
What recent work shows
Restoration has continued beyond the 20 years in the table. In a May 2025 county agenda item, officials reported that the Sector 4 hurricane-related dune renourishment contract had been reduced from its original $6.68 million award to a final construction cost of approximately $5.18 million after less sand was required than initially estimated. The work placed approximately 116,971 cubic yards of sand and 147,788 dune plants.
The county also reports that its Sector 5 restoration work was completed in March 2026, placing 115,901 cubic yards of beach-compatible sand and installing 117,500 native dune plants. Those projects illustrate why it is necessary to distinguish estimated contracts, revised construction costs, a particular year's accounting expenditures and money subsequently reimbursed by another agency.
They also show why evaluating the life of a project matters. A beach is not a permanent stockpile of sand. Material moves as waves, tides and storms reshape the shore. Whether that movement represents a project performing its protective function, a shortfall in design or a need for future work must be determined through coastal measurements rather than photographs alone.
The information taxpayers still deserve
The most useful next step would be a public project-by-project accounting showing initial estimates, final costs, reimbursements, local shares and maintenance obligations. The county could also publish the number of cubic yards placed per segment and the condition of each segment after subsequent storm seasons. Residents should be able to compare the cost of protecting heavily used public beach access with the cost of protecting reaches adjoining private property.
Officials should also explain what alternatives have been evaluated, including dune vegetation, altered sand management, setbacks, beach-access improvements and, where feasible, measures that reduce future exposure. None is costless or appropriate for every shoreline. But comparisons help establish whether recurring nourishment is the most effective approach for the individual location.
The $102 million historical figure establishes the scale of one county program. It does not establish that the money was wasted, that the inlet caused all local erosion or that wealthy property owners were the only beneficiaries. The more consequential test is whether public records allow residents to identify where the money went, which public purposes were served and how well the resulting shoreline protection has held up.
Coming soon!